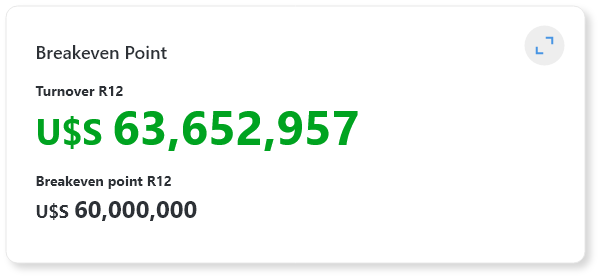
This KPI helps the dealership determine if the volume of sales is sufficient to cover fixed costs. It is crucial as it indicates the business’s viability. If the break-even point isn’t reached over several months, the business’s continuity may be at risk.
The KPI includes a second level of analysis that reveals, for example, the total sales and variable costs + expenses to calculate the contribution margin. In this example, 21% of total revenue represents the contribution margin, which is the amount available to cover fixed costs. When the contribution margin exceeds the fixed costs, profit is generated.
For accurate calculation, it’s essential that fixed and variable costs are correctly classified. For instance, if sales and variable expenses increase in March, April, and May while fixed costs remain stable, this is an expected outcome.
At the bottom, although the total calculation is a rolling 12 (accumulated over the last 12 months), the break-even point is shown month by month to identify special situations that may not be evident in the accumulated view.
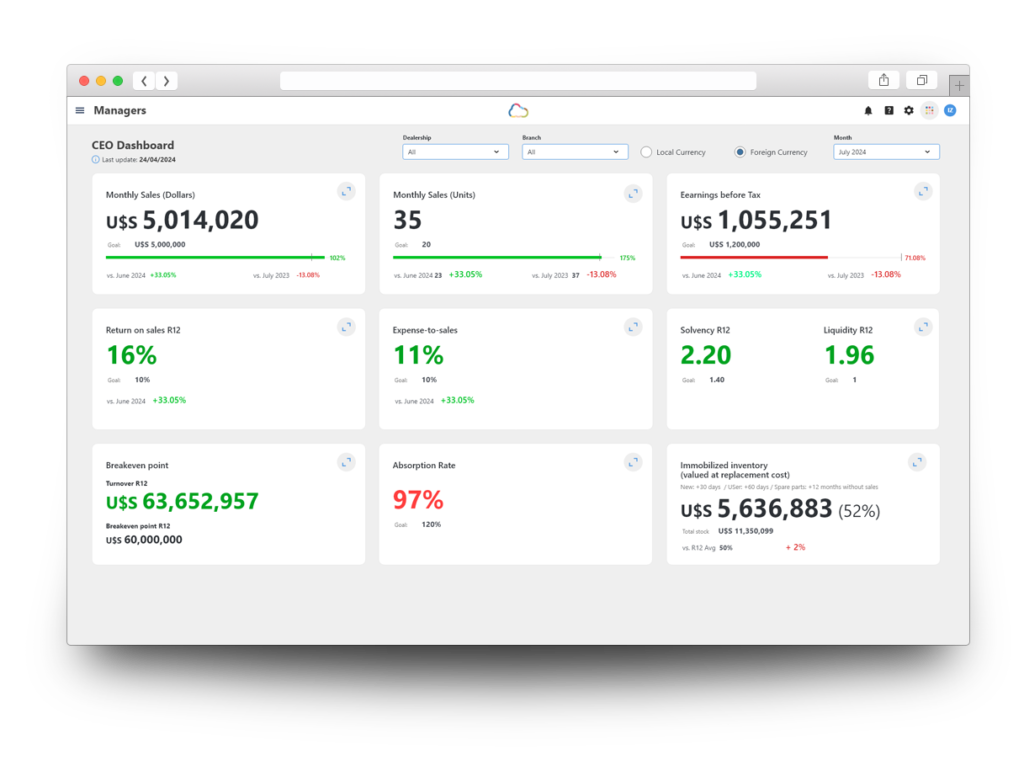
Which dashboard is this KPI on? Managers
What department does it affect? All departments.
Measurement frequency Monthly, using accumulated data from the last 12 months.
Target A variable value automatically calculated based on revenue and fixed/variable costs.
What happens if it is green?
Revenue covers fixed costs and leaves a surplus, which, barring other non-operating expenses, will be the company’s profit.
What happens if it is red?
Indicates that revenue is insufficient to cover fixed costs, meaning money is being lost. Although this KPI is measured with a rolling 12 (last 12 months accumulated), it is also presented month by month to quickly identify which month had the largest loss and analyze the causes.
Improvement Strategies
Analyze whether excessive discounts are being given or if the cost of sales is too high.
Implement strict control and monitoring of fixed expenses to eliminate unnecessary costs and reduce the amount that needs to be covered by revenue.
Relationship with other indicators
The Break-Even Point is linked to revenue, as revenue generates the contribution margin needed to cover fixed costs.
It is also related to the Absorption Factor, which serves as a break-even point but only considers the contribution from Parts and Service Departments, excluding vehicle sales contribution. If the Absorption Factor for parts and services meets expectations, the focus should shift to improving the Vehicle Sales Department to enhance the dealership’s overall break-even point.