These financial indicators measure the company’s health from the perspective of its debts and assets.
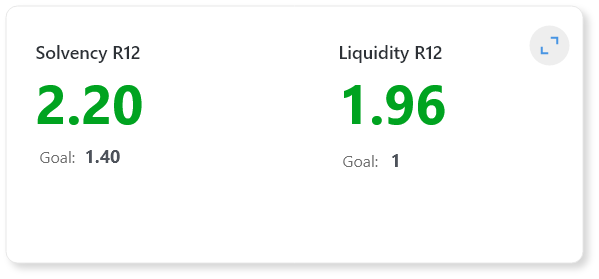
Solvency is calculated by dividing Total Assets by Total Liabilities. It assesses whether the company has sufficient resources (assets) to meet its obligations (liabilities). This is a global indicator closely related to Liquidity.
Liquidity is similar but focuses on current assets and current liabilities. It evaluates whether the company can obtain the necessary resources in the short term to cover its debts.
At the second level of this indicator, you can detail the composition of assets and liabilities, including current and non-current items, to understand the makeup of the balances that feed into these indicators. For instance, reviewing current assets can reveal whether the majority are in cash or accounts receivable.
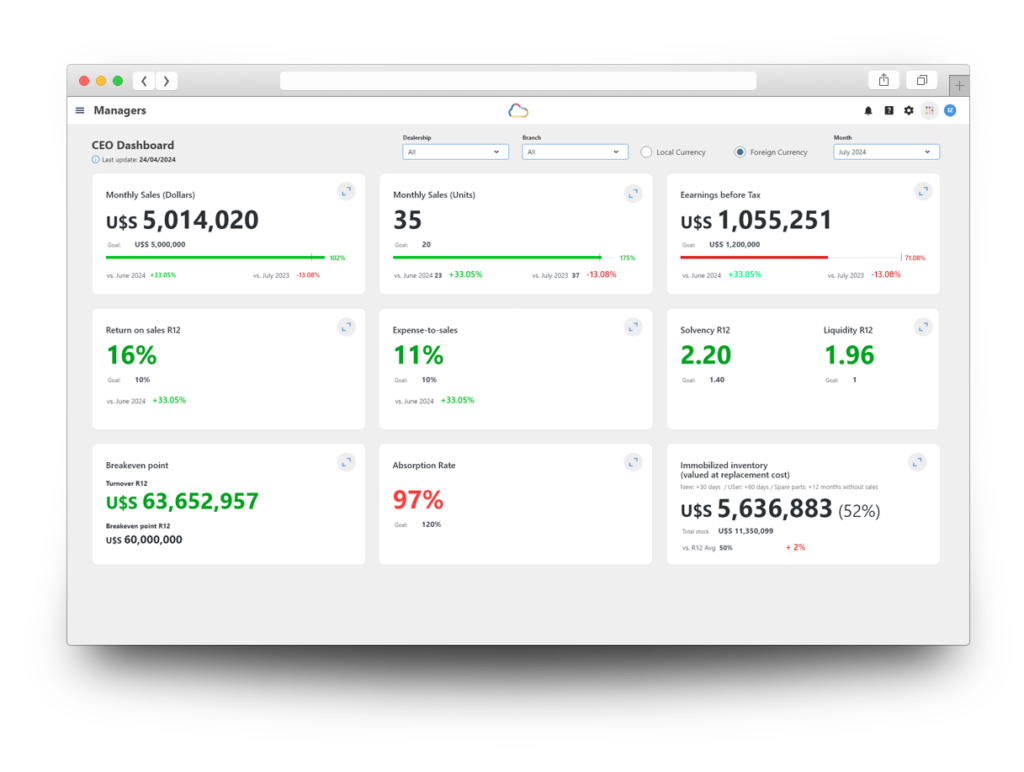
Which dashboard is this KPI on?
Managers
What department does it affect?
Dealership-wide. In a future version, it will also be available by department.
Measurement frequency
Monthly, using accumulated data from the last 12 months.
Target
Monthly, using accumulated data from the last 12 months.A fixed value defined by the dealership that is repeated each month.
What happens if it is green?
The company is financially healthy. For liquidity, this means it will be able to pay all its short-term debts.
What happens if it is red?
The company may face financial issues because it will have debts that it cannot pay due to insufficient assets.
It might need to seek a bank loan.
Improvement Strategies
It is crucial to manage collection and payment cycles effectively. For example, if you allow customers to pay within 30 days, you should not commit to paying your suppliers within 15 days. You cannot start paying your debts until you have collected the sales revenue. A good strategy to avoid financial issues is to constantly negotiate with suppliers based on your customer collection cycles.
The company might choose to extend payment terms to boost sales, while considering a source of income (such as a bank loan) to cover the necessary debts.
Relationship with other indicators
This indicator can be analyzed alongside revenue indicators. For example, extending customer payment terms from 30 to 60 days might increase revenue.
These examples illustrate that revenue should always be analyzed within a broader context.