
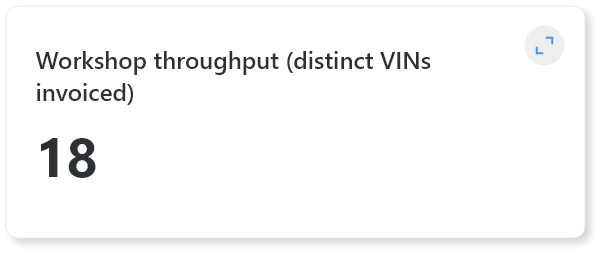
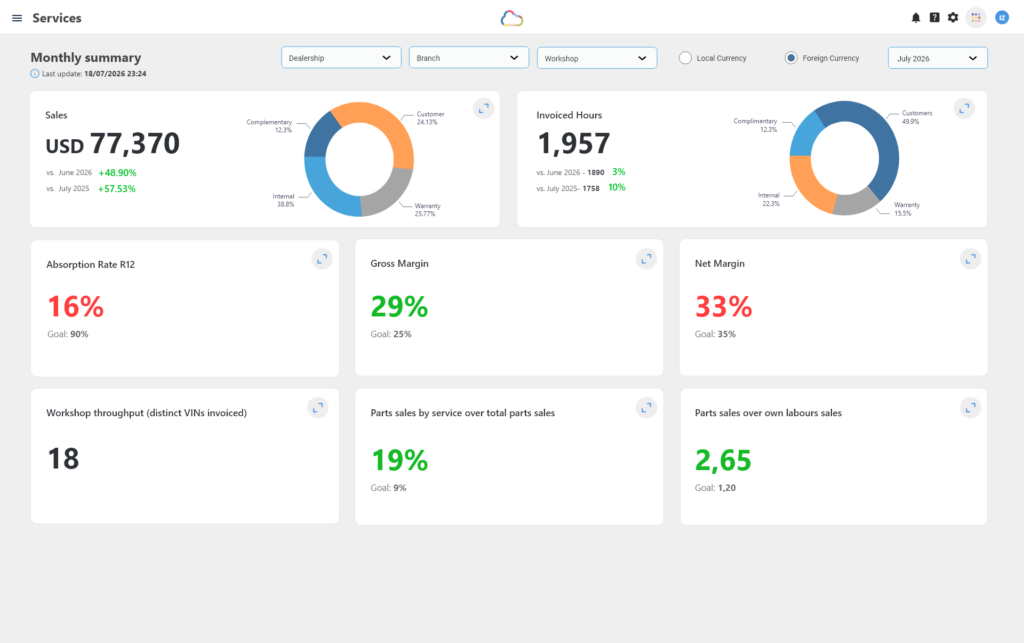


This KPI calculates the number of unique units — distinct VINs — that passed through the dealership’s workshop during a given period and received an invoice, regardless of whether the repair order was for labor, parts, or both. This indicator shows the actual volume of vehicles serviced and reflects the level of activity, customer retention, and visit frequency in the after-sales service area.
In addition, the dashboard details the model year of the units serviced, which makes it possible to analyze the age of the vehicle fleet visiting the workshop. This data is key for calculating customer retention, which many manufacturers use to evaluate the dealership’s after-sales performance.
Dashboard
Services
Departments
Services
Frequency
Monthly
Goal
The goal is to increase the frequency and number of customer visits to the workshop, ensuring that owners maintain their relationship with the dealership after the sale.
A high number of workshop visits indicates that many customers are returning for service, reflecting stronger loyalty, a good customer experience, and commercial efficiency.
A low value may indicate customer loss to external workshops, lack of follow-up, or weak after-sales communication.
To improve the “Workshop Visits” KPI, the dealership should focus on strengthening the after-sales relationship with its customers through actions that encourage recurrence and satisfaction. This includes implementing automatic maintenance reminders, offering loyalty programs with benefits for recurring visits, and maintaining active follow-up through phone or digital channels to ensure that customers return to the official service center.
Once we receive your details, we’ll contact you by email to share information or to schedule a meeting or demo.
Your data is secure. This is our privacy policy.