
Analyze the composition of your labor sales and discover which types are the most profitable.
This indicator shows you the distribution of your labor sales to see if technicians spend more time on customer, internal or warranty work.
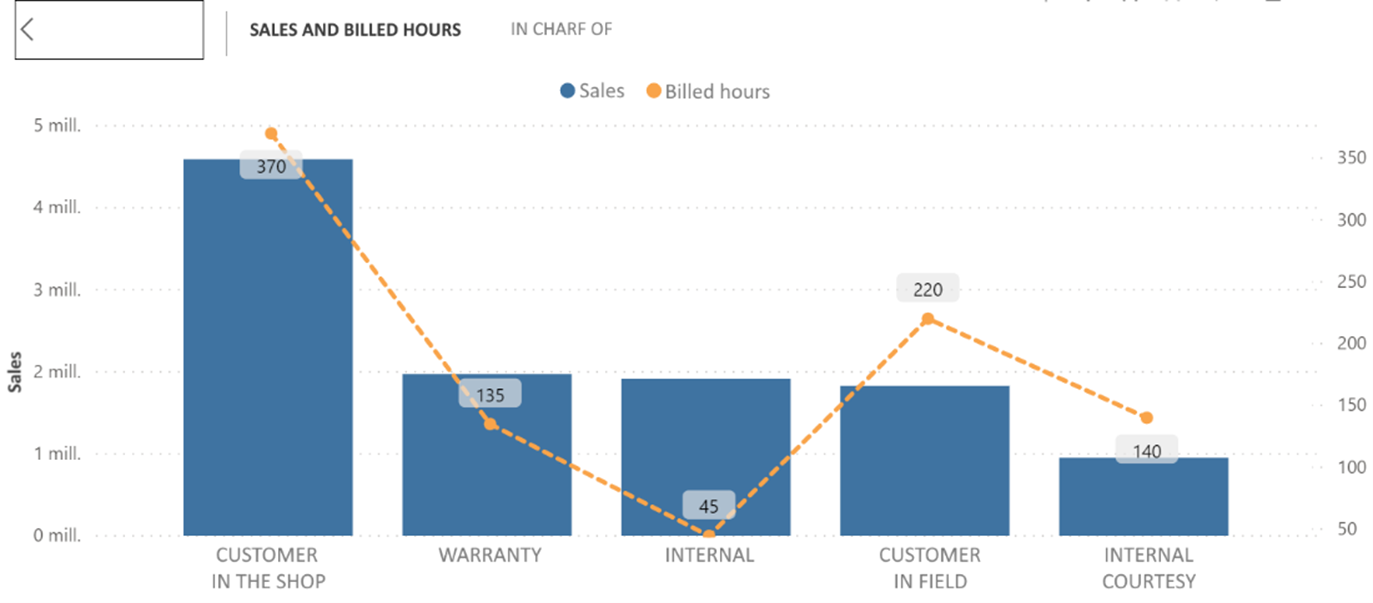
This graph shows an ideal situation, where most of the Service Department’s hours are billed to workshop customers.
The hourly rate for customer work is higher than the rate for guarantee work; and internal work is an expense that is absorbed by the dealership.
A good strategy to improve this KPI is to train service advisors to detect and offer the customer additional work every time they receive a vehicle and open a repair order.
Subscribe to the blog
Receive the new articles via email. No spam; you can unsubscribe whenever you want.