Let me start with an uncomfortable question: How many different versions of your dealership’s monthly results are currently circulating?
Sales sent you one spreadsheet. After-Sales sent another. Administration manually cross-referenced them, and by the time the report reached your desk, the new month was already underway.
That’s the real cost of having scattered data: you’re making decisions based on numbers no one can verify, debating which source to trust, and reviewing results that can no longer be changed.
The Problem Isn’t a Lack of Data. It’s That Your Data Is Scattered.
Dealerships generate information all day long. Every sale, every transaction, every workshop repair order, and every inventory movement is recorded somewhere.
The problem starts when that information is exported, copied, and rearranged into separate files, increasing the risk of manual errors and inconsistencies.
Managers often describe the situation in very similar terms:
- “I can’t calculate my dealership’s KPIs.”
- “I don’t know whether I’m making or losing money on each sale.”
- “I don’t know how much money is tied up in inventory.”
- “I don’t trust the numbers I’m being sent.”
That last statement is the most concerning. Without confidence in the data, KPIs lose their value, even when the numbers are there.
What Does Integrated Analytics Really Mean?
Consolidating data isn’t about putting more spreadsheets into a shared folder. It’s about having every department, branch, and dealership in your group feed into reports automatically, without manual work. Almost seamlessly.
With Autologica Sky DMS, the source of that information is the system where your day-to-day operations are recorded. That’s why your KPIs don’t have to pass through multiple hands before reaching you.
What you see reflects what’s actually happening in your DMS, with no intermediaries and no room for subjective interpretation.
Autologica Analytics takes that data and calculates your accounting, financial, and operational KPIs. There’s no need to build pivot tables or chase down information from individual managers.
Before and After: From Manually Compiled Reports to Dashboards in Minutes
In the past, the process was familiar: export reports, create pivot tables, cross-reference information, write a clear summary, and send it to management.
This process carries a high risk of errors. On top of that, anyone can manually edit the spreadsheet, undermining its credibility.
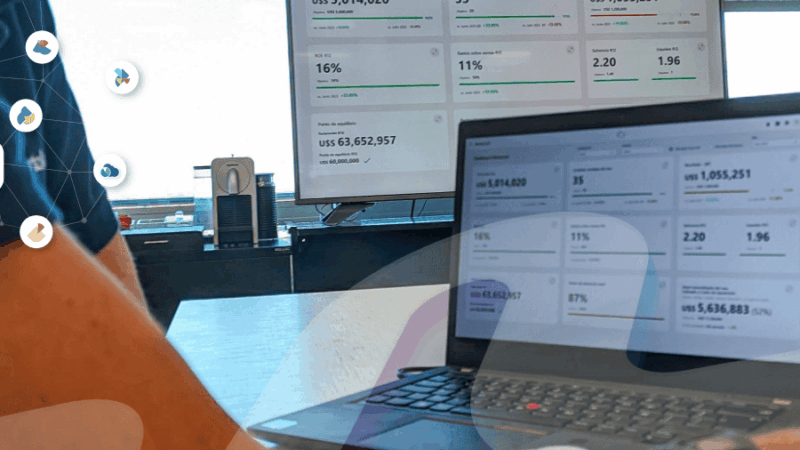
Now, in less than two minutes, you can view reports for every dealership, branch, and department. Simply open Analytics from your computer or smartphone, and your KPIs are already calculated.
You don’t have to wait until month-end to know how your business is performing. And you no longer need to ask each manager for their numbers.
What You Can See When Everything Is in One Place
With all your data integrated, managers can compare performance, drill down into individual KPIs, and identify problems before they escalate.
So, what does a typical day look like for a dealership owner or manager?
- Review a company-wide dashboard featuring accounting, financial, and operational KPIs, including sales, margins, expenses, and targets.
- Check the inventory holding dashboard to see how much capital is tied up in stock.
- Quickly analyze the budget for the entire company and each department.
- Review rankings to see how each dealership, branch, or department performs against key KPIs.
- Identify opportunities by reviewing sales potential and encouraging the sales team to make the most of every campaign.
Whether you’re an owner, general manager, or department manager, you can move beyond day-to-day operational tasks and dedicate more time to strategic decisions.
How to Start Building a Data-Driven Routine
You don’t need to change everything at once. A few simple steps can help you get started:
- Choose a measurement tool.
- Decide what you want to measure. Start with three KPIs per department that you currently can’t calculate with confidence.
- Start with a comparison. Put two branches side by side and see where their results differ.
- Drill down into the details. When a number surprises you, dig deeper until you find the reason behind it.
- Build your dashboard. Bring together the KPIs you review every morning in one place.
One Version. One Conversation.
Consolidating all your data in one place doesn’t add more reports to your weekly workload. Quite the opposite: it eliminates the ones you no longer need and restores confidence in the numbers you see.
When every branch and department speaks the same language, meetings stop being about arguing over whose numbers are right and start focusing on what to do with them.
If you’d like to see how this would work with your dealership’s actual operations, the best way is to walk through it together in a personalized demo.
Subscribe to the blog
Receive the new articles via email. No spam; you can unsubscribe whenever you want.