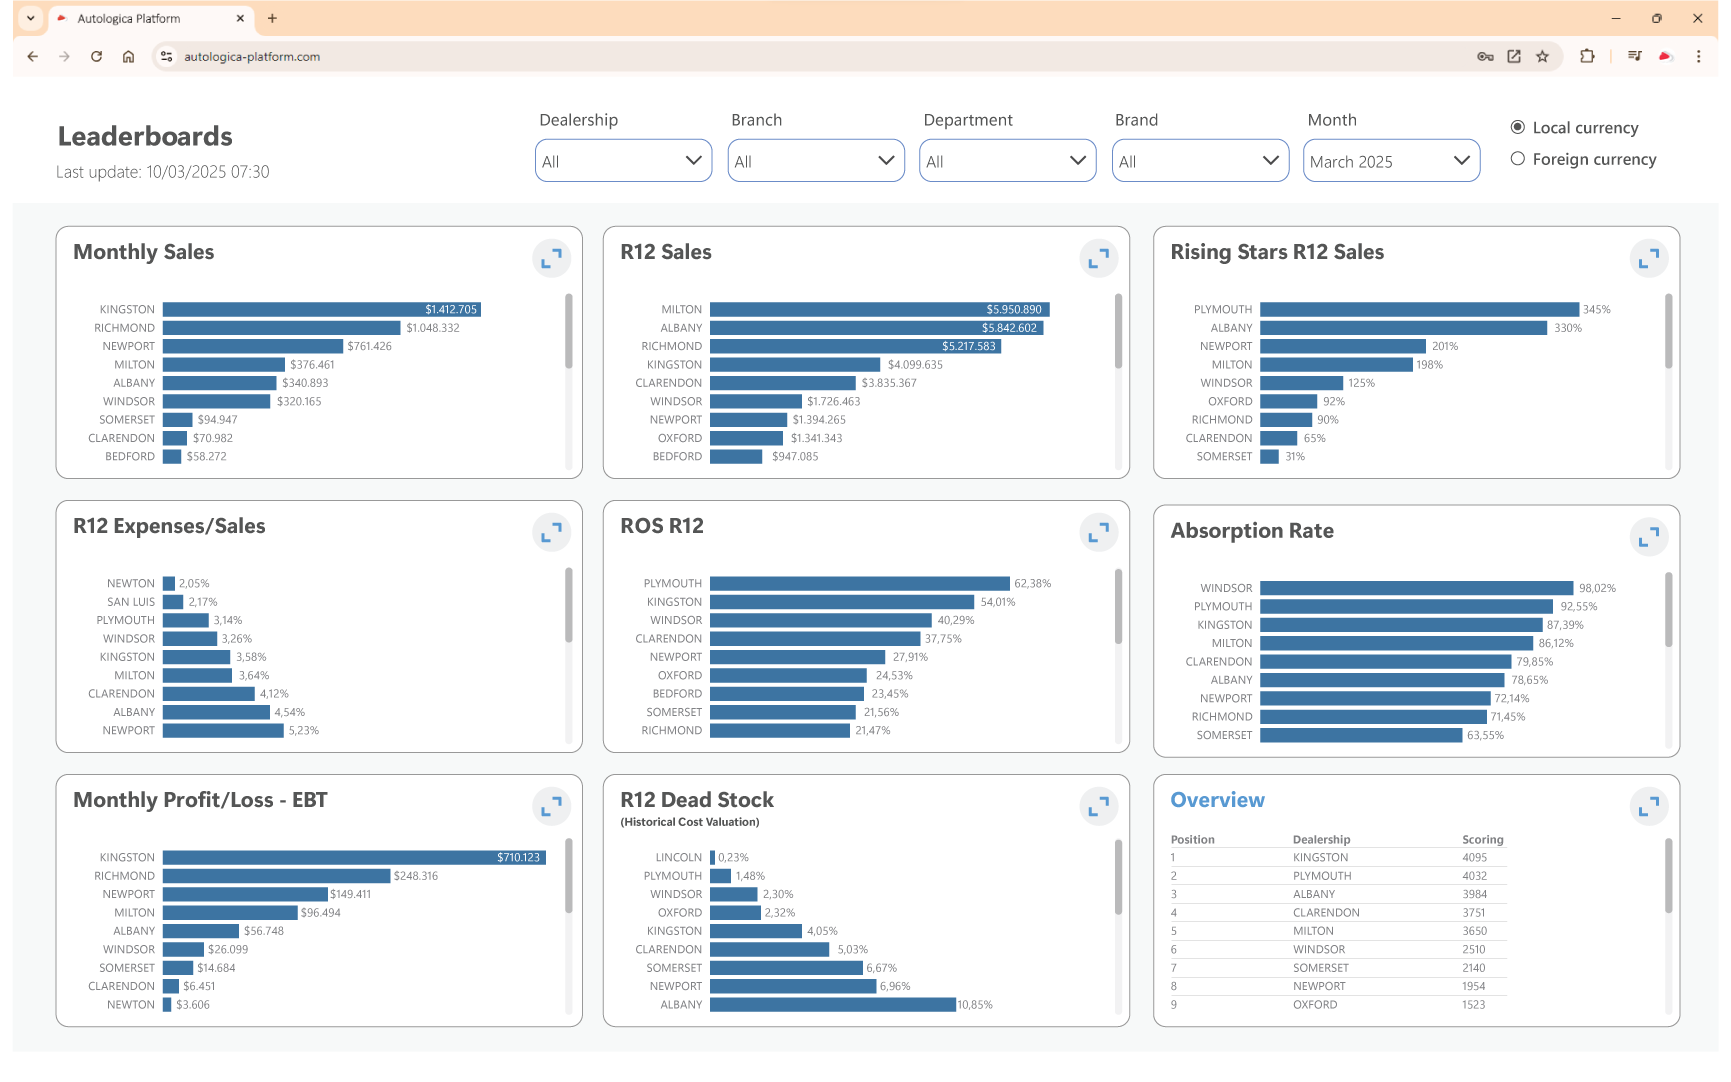
Check the Leaderboards panel to see how your stores and dealerships (if you are dealer group) rank in key metrics such as sales, expenses, growth, ROS, net income, absorption rate, idle inventory, and more.
The Scoring card displays an overall ranking based on a weighted average of all indicators.
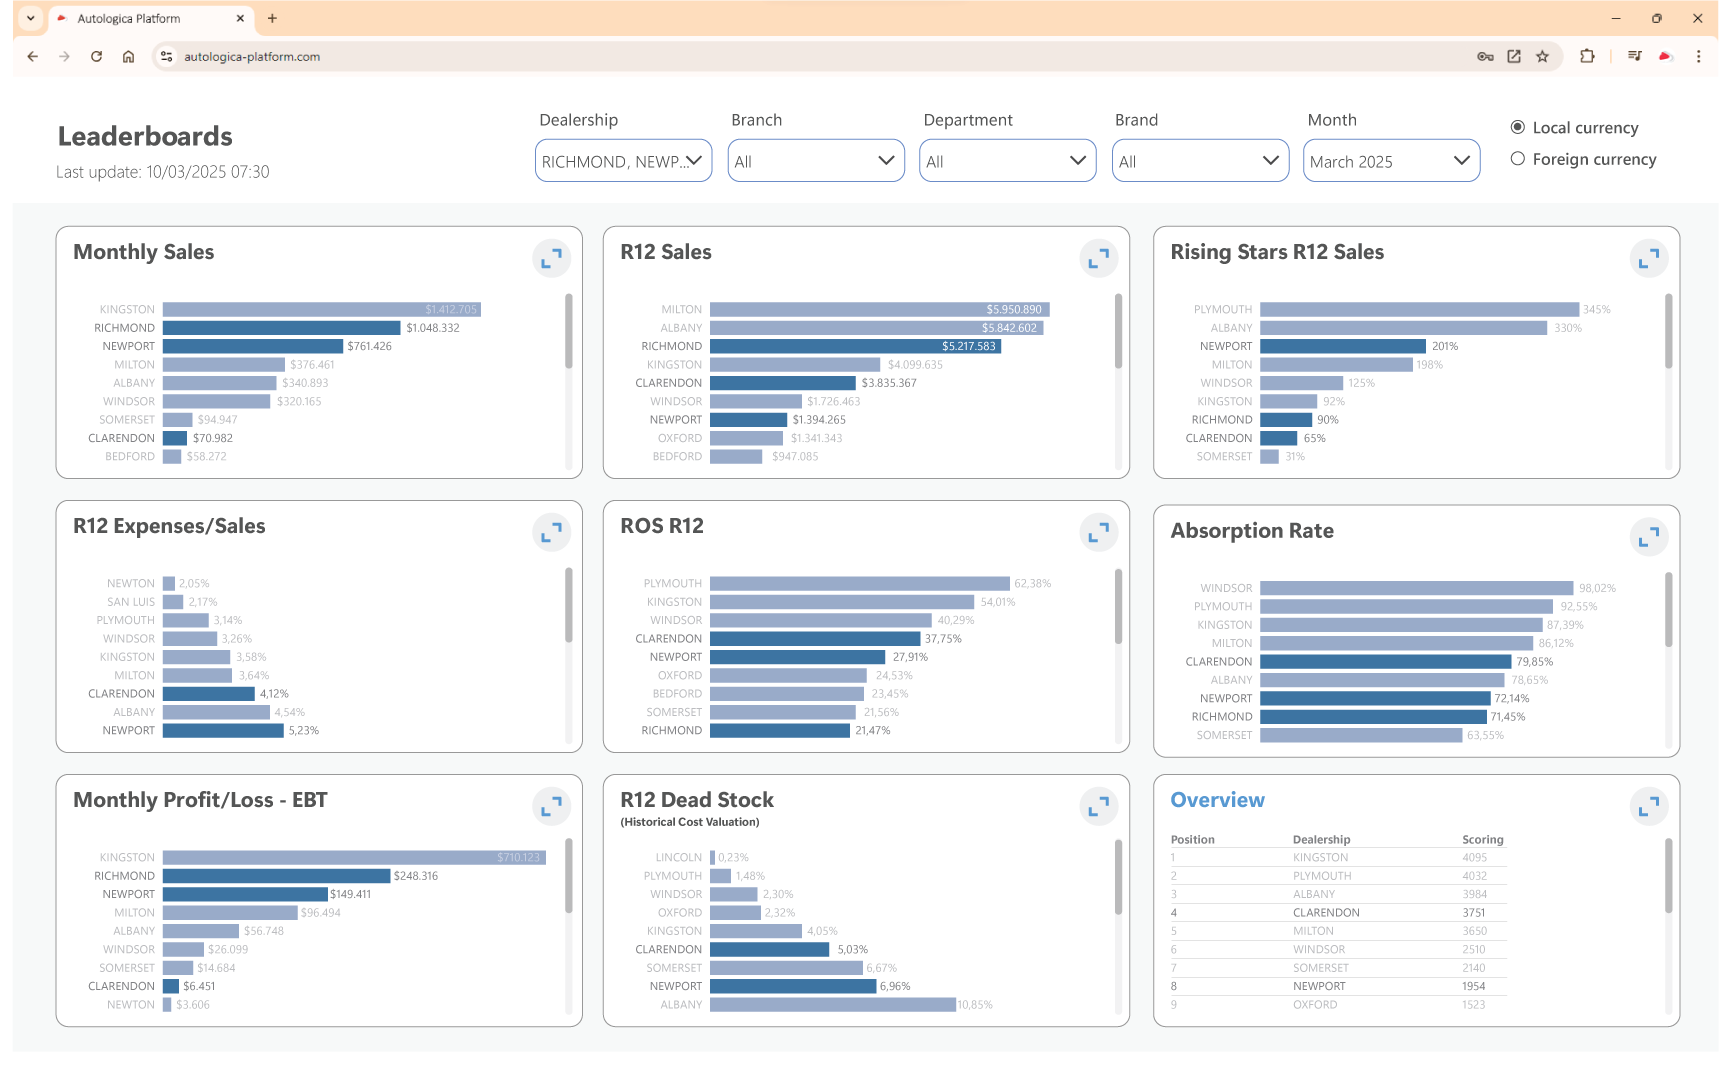
Select one or more locations to clearly visualize and compare performance on each KPI and compare them. For example, you can view dealerships or stores for a specific brand.
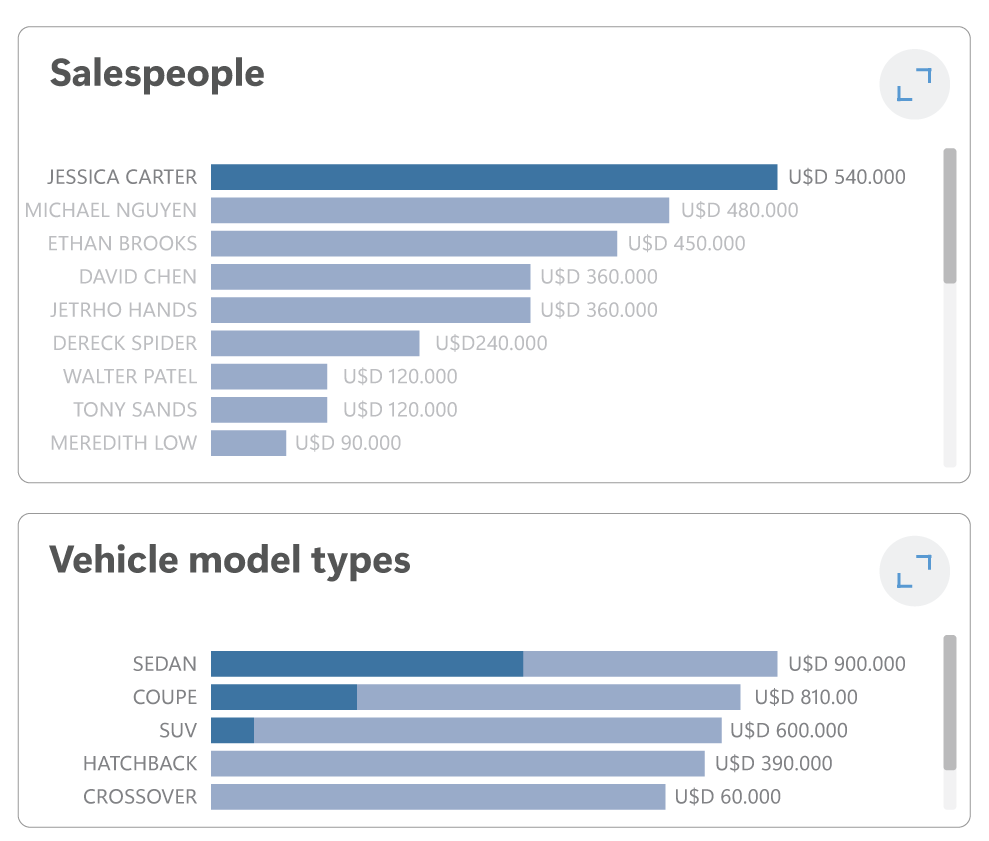
If you need more details on a specific metric—such as sales by salesperson—you can drill down into that data.
Each KPI has multiple levels to explore detailed information.