
This financial indicator shows the dealership’s profitability based only on its operating activities. It excludes gains or losses from financial investments, interest earned on fixed-term deposits, and, for example, the sale of fixed assets, as these are transactions that are not directly related to the core operation of the business.
This indicator takes into account sales, costs, and expenses related to the Parts, Service, New Vehicle, and Used Vehicle business units. Administrative expenses are also included, such as HR expenses, accounting fees, and other expenses required to operate the business.
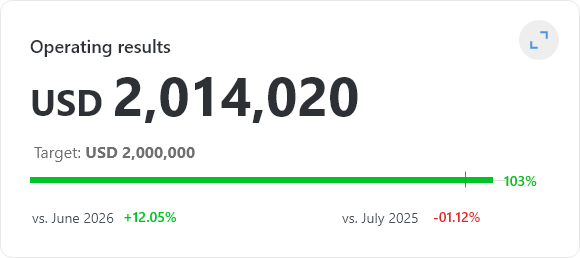
The expenses reported in the Income Statement as other operating income/expenses, other income/non-operating income, and financial expenses are not included in this indicator.
This indicator is analyzed together with the EBT result indicator. For example, the EBT result may be low due to a poor financial investment that negatively affected the dealership’s final result. However, the operating result may still be in line with expectations, making this indicator useful for measuring the health of the dealership’s core business operations.
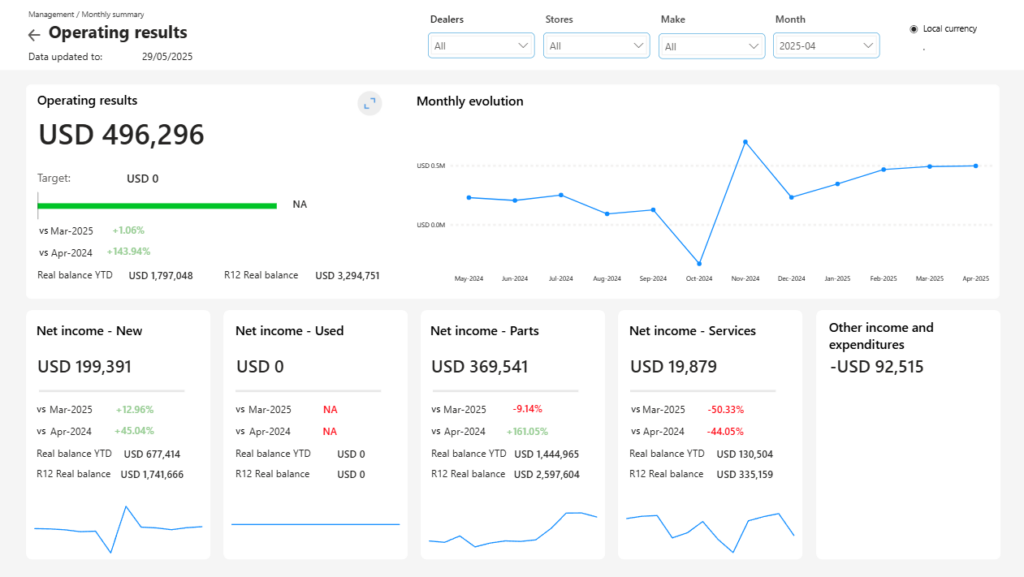
At the second level of this indicator, the operating result for each of the departments mentioned above is detailed. The amount shown on the right as Other Income/Expenses (-$382,948) corresponds to the administrative expenses required to operate the business.
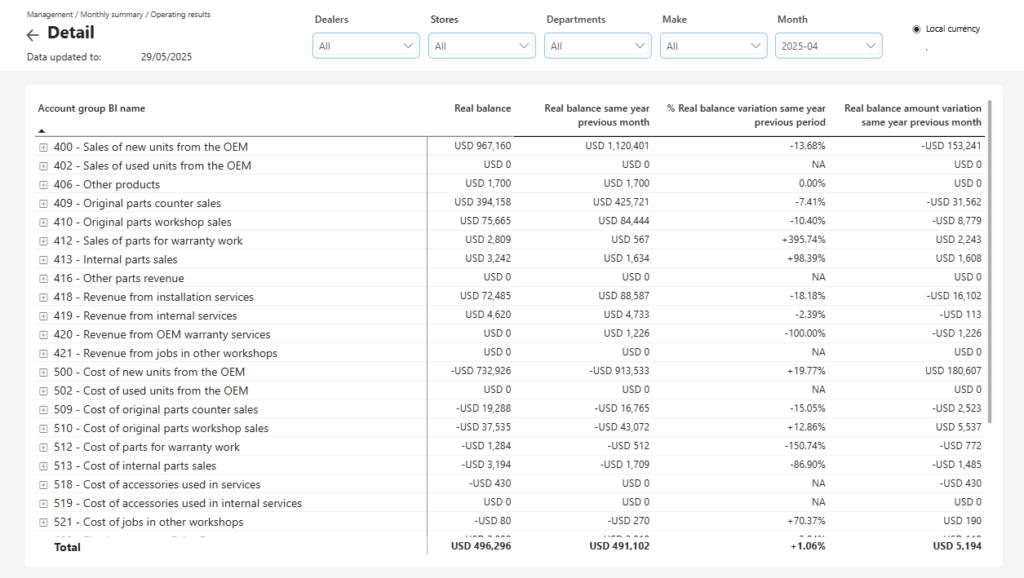
This can be validated by drilling down to the third level, where that amount is shown to be made up of fixed and variable administrative expenses.
Dashboard
Management
Departments
All
Frequency
Monthly
Goal
The operating result target is defined by the dealership in its annual budget.
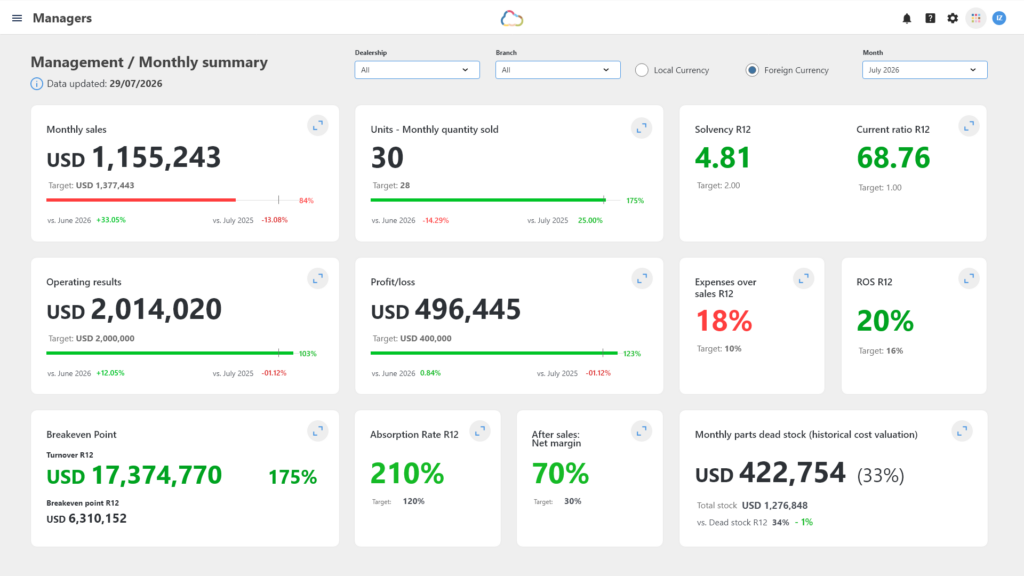
What happens if it is green?

The result target established in the annual budget was achieved.
What happens if it is red?

The projected profit target was not achieved. If the target is not met, all strategies related to the budgeted result should be reviewed.
Improvement Strategies
Identify which business unit is generating the lowest net result and try to determine where the issue lies. Are margins low? Are costs high? Are expenses excessive? Are they being allocated correctly?
Perform a comprehensive review of the composition of sales, costs, and expenses in each department.
Analyze expense allocations. This is an important point, as some departments may be absorbing expenses that do not fully belong to them.
At the dealership level, after reviewing each department, if the result remains low, the analysis can continue by reviewing the composition of other items that do not directly affect the departments and are shown under Other Income and Expenses.
Relationship with other indicators
This indicator is linked to Revenue indicators because, under normal conditions, an increase in revenue should translate into an increase in the company’s financial result and profit. If this does not happen when revenue increases, it may be because ROS is low and expenses are absorbing the revenue increase, preventing it from turning into profit.
It is also linked to the EBT Result indicator. Both indicators may even show opposite results, with one showing a profit and the other a loss. This may happen, for example, if the company sold a fixed asset, lost money on that sale, and the loss caused the dealership’s final result to become negative. However, from an operating perspective, the business may still be healthy.