
Registered quantity
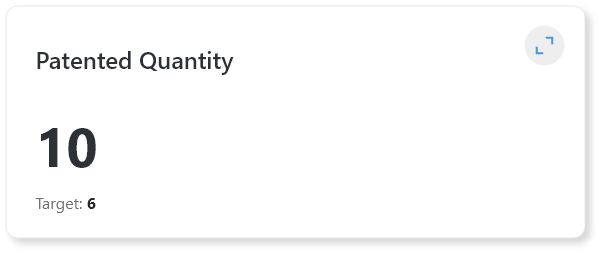
KPI Library Registered Quantity This KPI measures the total number of new vehicles units registered during a given period, generally on a monthly basis. DashboardSales Department Commercial Department Dealership goals in relation to the brand FrequencyMonthly GoalMeet the brand’s target. What happens if it is green? The registration target has been met. Reaching or exceeding […]
Units Dead Stock
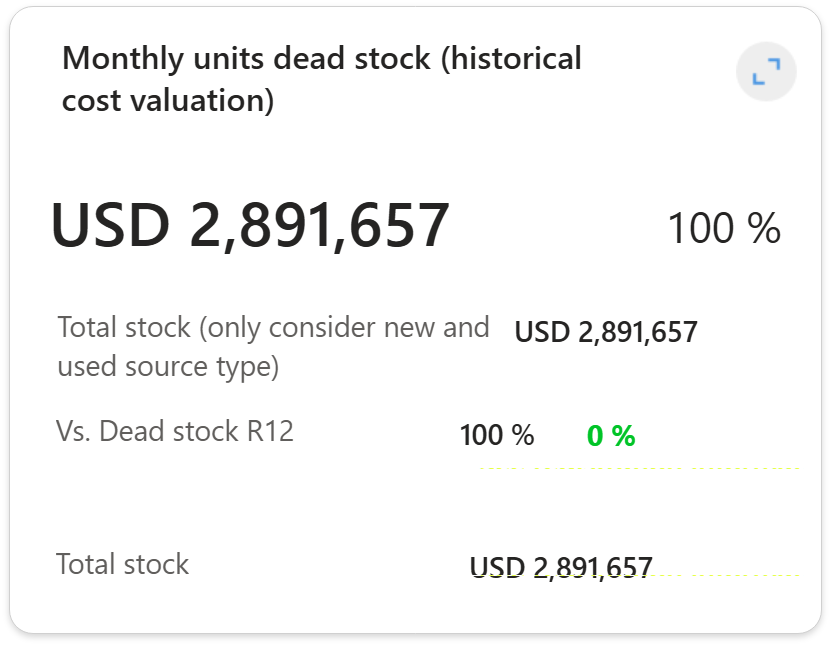
KPI Library Units Dead Stock This KPI calculates the amount represented by units — new and used — that remain in inventory without rotation during a given period, valued at historical cost. It makes it possible to understand what proportion of total stock is “immobilized,” representing tied-up capital that does not generate revenue and directly […]
Operating results
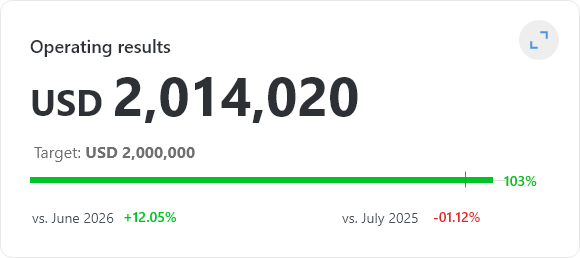
KPI Library Operating Results This financial indicator shows the dealership’s profitability based only on its operating activities. It excludes gains or losses from financial investments, interest earned on fixed-term deposits, and, for example, the sale of fixed assets, as these are transactions that are not directly related to the core operation of the business. This […]
Earnings Before Taxes (EBT)
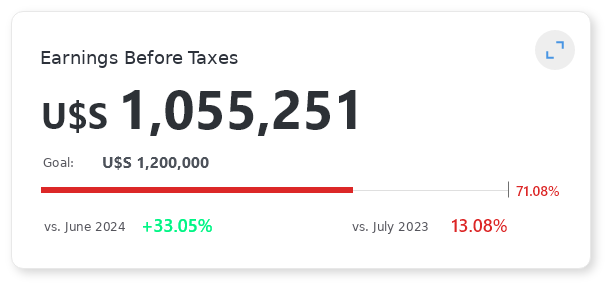
KPI Library Earnings Before Taxes This financial indicator shows the dealership’s profitability before income tax, which is why it is referred to as EBT: Earnings Before Taxes. This indicator allows the dealership to determine whether the monthly result was positive or negative, taking into account the dealership’s sales, costs, and expenses. The second level of […]
Absorption Rate
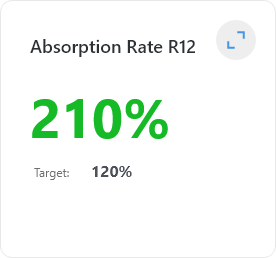
KPI Library Absorption Rate This indicator shows whether the marginal contribution generated by the Parts and Service departments is sufficient to cover the dealership’s total fixed expenses. It is a key indicator for determining whether the dealership can cover its total fixed costs using only Parts and Service sales, since vehicle or machinery sales may […]
Units Sold

KPI Library Units Sold Why should I measure this? This indicator shows the number of vehicles sold. It can be analyzed against the dealership’s defined target, compared to the previous month, and against the same month from the previous year. At the second level of this KPI, a more detailed analysis is possible through navigation […]
Solvency and Liquidity
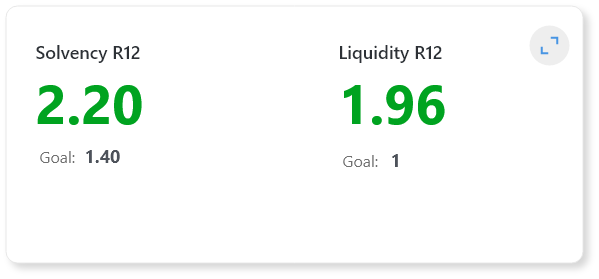
KPI Library Solvency and Liquidity Why should I measure this? These financial indicators measure the company’s health from the perspective of its debts and assets. Solvency is calculated by dividing Total Assets by Total Liabilities. It assesses whether the company has sufficient resources (assets) to meet its obligations (liabilities). This is a global indicator closely […]
ROS – Return over Sales

KPI Library ROS – Return over Sales Why should I measure this? This indicator allows the dealership to understand profitability per currency unit of revenue. It takes the dealership’s pre-tax earnings and divides them by sales. At the second level, this indicator is broken down for more detailed information: Monthly ROS evolution. Business ROS considers […]
Breakeven Point
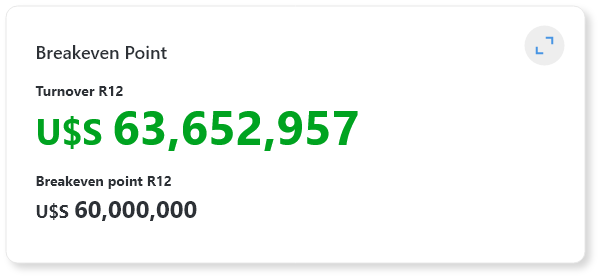
This KPI helps the dealership determine if the volume of sales is sufficient to cover fixed costs.
Expense-to-Sales Ratio

This KPI allows the dealership to monitor the evolution of fixed and variable operational expenses in relation to sales.